Here are 10 SAT statistics questions, written in SAT style, with full working. They cover mean, median, spread, tables and samples. Each wrong option gets its trap and mistake type. We wrote them: they are not real past questions.
10 questions · 16 minutes
What this SAT data set covers
These are Problem-Solving and Data Analysis questions. College Board puts 5 to 7 in each SAT. Skills include one-variable data, samples and statistical claims.
Centre and spread
Median, a frequency table, standard deviation, a range in °F, a sample.
Tables and changes
A two-way table, a corrected mean, a new value, mean or median, an experiment.
Read the title, units and totals first
Check what each number counts, its units, and which total the question uses.
| You have | Fast route |
|---|---|
| A list of 6 or more values | Desmos: mean([…]) or median([…]) |
| A frequency table | Multiply each value by its count, then add |
| A two-way table | Circle the group the question names |
Give yourself 16 minutes. Typed answers: up to 5 characters, 6 if negative. Next to each miss, write its Free BMI Maths Test type.
SAT statistics questions 1 to 5
Question 1
Noura timed her metro trip to Sharaf DG station on 8 days. The times, in minutes, were 34, 29, 41, 31, 30, 38, 29 and 36. What is the median time? (Made-up data.)
- 30.5
- 32.5
- 33.5
- 29
Show answer
Answer: B, 32.5. In order: 29, 29, 30, 31, 34, 36, 38, 41. The middle pair is 31 and 34, and (31 + 34) ÷ 2 = 32.5.
Desmos (faster): median([34,29,41,31,30,38,29,36]).
Why the others tempt: A uses the middle pair before sorting: CNC, concept not clear. C is the mean: DRC, did not read carefully. D is the mode.
Question 2
Passengers on 20 taxi trips. (Made-up data.)
| Passengers | 1 | 2 | 3 | 4 |
|---|---|---|---|---|
| Trips | 8 | 6 | 4 | 2 |
What is the mean number of passengers per trip?
- 2
- 2.5
- 5
- 8
Show answer
Answer: A, 2. Total passengers: 1×8 + 2×6 + 3×4 + 4×2 = 40. Mean: 40 ÷ 20 = 2.
Why the others tempt: B averages 1, 2, 3 and 4 and ignores the counts: CNC. C is 20 ÷ 4. D is the biggest count.
Question 3
Morning temperatures in Hatta on 5 days were 12, 14, 16, 18 and 20 °C. Dubai was 10 °C warmer each day. Which is true about the standard deviations? (Made-up data.)
- Hatta’s is larger.
- Dubai’s is larger.
- They are equal.
- It cannot be known without a calculator.
Show answer
Answer: C, equal. Standard deviation measures how far values sit from their mean. Adding 10 to every value moves the mean, but not the gaps.
Desmos: stdev gives the same number for both lists, but the idea is faster.
Why B tempts: bigger numbers seem to mean bigger spread: CNC.
Question 4
One week’s daily highs in Dubai had a range of 5 °C. Each is changed to °F with F = 1.8C + 32. What is the range in °F? (Made-up data.)
- 5
- 9
- 37
- 41
Show answer
Answer: B, 9. Range = highest − lowest. The + 32 cancels out. The × 1.8 does not: 5 × 1.8 = 9.
Quick test: 30 and 35 °C become 86 and 95 °F, a gap of 9.
Why the others tempt: D (9 + 32) and C (5 + 32) add 32 to a gap: CNC. A ignores the change of units: DRC.
Question 5
A gym in Dubai picked 300 of its members at random. 72% of them said they visit at least 3 times a week. Which conclusion is best supported? (Made-up data.)
- About 72% of all UAE adults go to a gym 3 or more times a week.
- About 72% of this gym’s members go 3 or more times a week.
- Exactly 216 of this gym’s members go 3 or more times a week.
- Going 3 times a week makes people healthier.
Show answer
Answer: B. A random sample of the gym’s members speaks only for the gym’s members.
Why the others tempt: A says the sample result holds for everyone: CNC. C: 216 is 72% of the 300 asked, not of all members. D claims a cause from a survey: CNC.
Free BMI Maths Test
Read the table wrong? The test finds why.
Was it the idea, the reading or the copying? The Free BMI Maths Test tells you, and shows the level you work at now.
Tables and changes: SAT-style data questions
Question 6
How 160 visitors reached a Dubai museum. (Made-up data.)
| Travel | Under 18 | 18 and over | Total |
|---|---|---|---|
| Metro | 36 | 44 | 80 |
| Taxi | 9 | 30 | 39 |
| Car | 15 | 26 | 41 |
| Total | 60 | 100 | 160 |
Of the visitors aged 18 and over, what percent came by taxi?
- 15%
- 18.75%
- 30%
- 76.9%
Show answer
Answer: C, 30%. “Of the visitors aged 18 and over” names the column. Its total is 100, and 30 came by taxi.
Why the others tempt: D divides by the taxi row total, 39, and B by all 160: DRC. A reads the under-18 column, 9 ÷ 60: CWV, copied a wrong value.
Question 7
9 daily temperatures have a mean of 38 °C. The largest, 44, was typed as 47 by mistake. What is the corrected mean? (Made-up data.)
Show answer
Answer: 113/3, or 37.66, or 37.67. Old total: 9 × 38 = 342. New total: 339. And 339 ÷ 9 = 113/3.
Typing it: 113/3 fits. A long decimal is cut or rounded “at the fourth digit”, says College Board.
Median: no change, because the largest value is still the largest.
Why 35 tempts: 38 − 3 forgets that the 3 is shared by 9 values: CNC.
Question 8
Seven drive times to work, in minutes, are 22, 25, 27, 31, 33, 36 and 40. An eighth time, 18 minutes, is added. What is the new median? (Made-up data.)
Show answer
Answer: 29. In order: 18, 22, 25, 27, 31, 33, 36, 40. The median is the mean of the 4th and 5th: (27 + 31) ÷ 2.
Why 31 or 27 tempts: 31 is the old median, but a new low value pulls it down. 27 is one middle value of an even set. Both: CNC.
Question 9
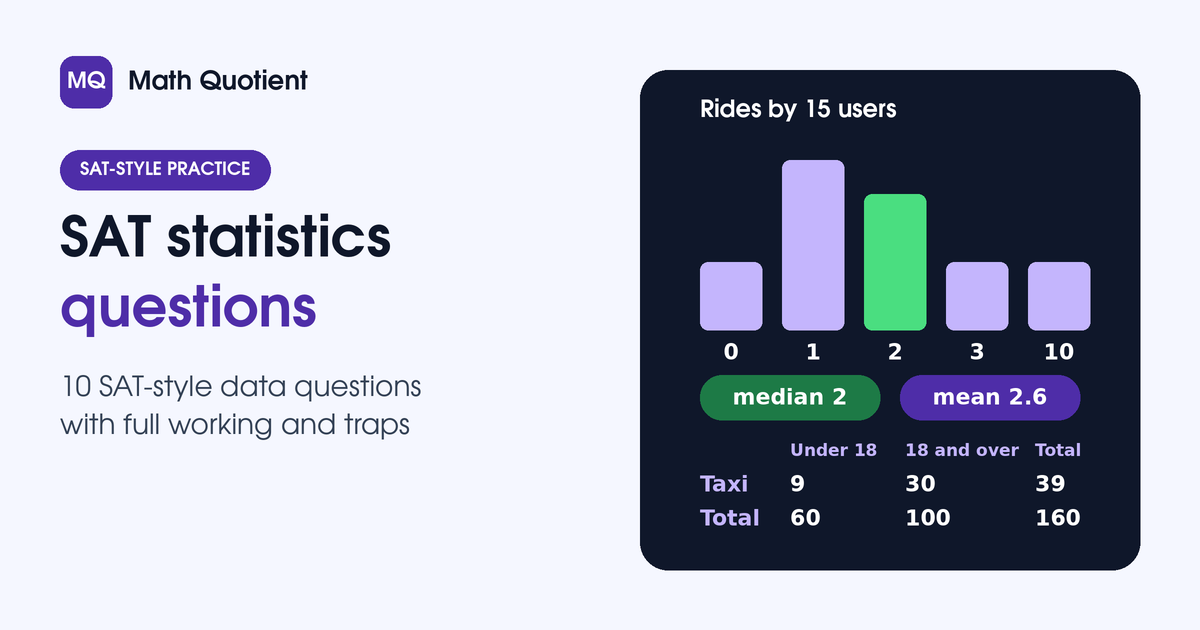
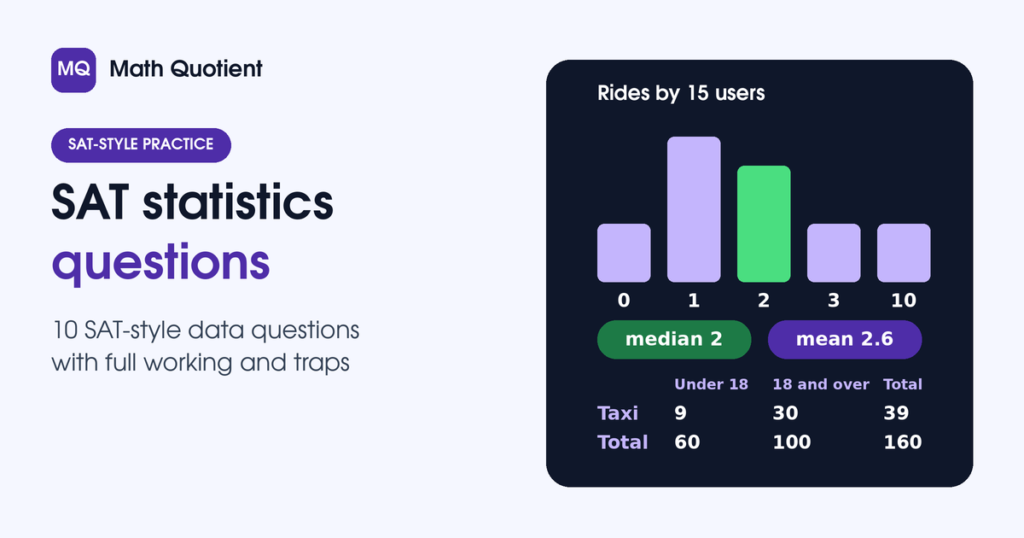
Rides by 15 e-scooter users in one week. (Made-up data.)
| Rides | 0 | 1 | 2 | 3 | 10 |
|---|---|---|---|---|---|
| Users | 2 | 5 | 4 | 2 | 2 |
Which is true about the mean and the median of the number of rides?
- The mean is greater than the median.
- The median is greater than the mean.
- They are equal.
- There is not enough information.
Show answer
Answer: A. The median is the 8th value. Values 1 to 7 are 0 or 1, and the 8th is 2. The mean is (0 + 5 + 8 + 6 + 20) ÷ 15 = 2.6.
Why the others tempt: C reads the middle of the header row. B lets the zeros outweigh the 10s: CNC. A slip in the total, 39: CMT, calculation mistake.
Question 10
In a study, 80 adult volunteers in Abu Dhabi were split at random into two groups of 40. One group drank 2 extra glasses of water a day. That group had fewer headaches. Which conclusion is best supported? (Made-up study.)
- Extra water cuts headaches for all UAE adults.
- Extra water likely cuts headaches for people like these volunteers.
- No cause can be claimed, because they were volunteers.
- Fewer headaches make people drink more water.
Show answer
Answer: B. Random groups let you claim a cause. The volunteers were not a random sample of UAE adults, so the claim covers people like them only.
Why the others tempt: A stretches the result to everyone. C forgets what random groups allow. D turns the cause around. All: CNC.
Score yourself
| Your score | Meaning | Next step |
|---|---|---|
| 9 or 10, on time | Data questions are safe marks. | Add mixed sets with scatter plots. |
| 7 or 8, or slow | Reading slips or slow lists. | Use Desmos for every list of 6 or more. |
| 6 or fewer | An idea behind the slips. | Take the Free BMI Maths Test. |
Scored 6 or under? The Free BMI Maths Test shows the cause. Parents: ask your child to name the group out loud before dividing.
Practise next
For official data questions, filter College Board’s Student Question Bank by Problem-Solving and Data Analysis.
Right data, wrong total?
The Free BMI Maths Test shows why each mark was lost.
Questions people ask about SAT statistics
How many statistics questions are on the SAT?
There is no official count for statistics alone. The whole data area has 5 to 7 questions, shared with percentages, ratios and probability.
Do I need to work out standard deviation?
College Board’s skill list says “measures of center and spread”. It does not say you must work it out by hand. Most questions test the idea. Desmos has stdev if you need a number.
Can Desmos find the mean and median?
Yes. Type mean([…]) or median([…]) with the values inside. stats([…]) shows the count, mean, median and standard deviation at once.
Are these real SAT questions?
No. Math Quotient wrote them in SAT style, with made-up data. For official questions, use College Board’s Student Question Bank.
Sources
Facts checked on 12 November 2026. We checked all answers and wrong options in Python.
Written by Himanshu Jain
B.Tech, IIT Delhi. Founder of Math Quotient, Bur Dubai.